
Basic Price Action: Reading Your First Candlestick Chart in 5 Minutes (Deep Guide)
If you’ve ever opened a crypto exchange like Binance, Bybit, or OKX and stared at a chart full of red and green bars wondering what they mean — you’re not alone. Those bars are called candlesticks, and together, they form the foundation of price action trading — one of the most powerful ways to read market movements without relying on complicated indicators.
In just five minutes, you can learn to interpret these charts like a pro beginner. Let’s dive deep into the essentials.
1. What Is Price Action?
Price action is simply how price moves over time — no indicators, no algorithms, just pure market movement. Traders use it to understand who controls the market: buyers (bulls) or sellers (bears).
Every candlestick tells a story — it’s the “language” of the market. Learning to read it helps you anticipate what might happen next based on past behavior.
2. Understanding a Candlestick
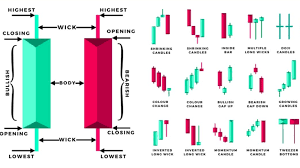
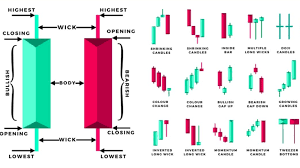
Each candlestick represents price movement over a specific period — for example, 1 minute, 1 hour, or 1 day.
Here’s what each part means:
- Body: The thick middle part of the candle. It shows the opening and closing prices.
- Green candle: Price closed higher than it opened (bullish).
- Red candle: Price closed lower than it opened (bearish).
- Wicks (or shadows): The thin lines above and below the body.
- Upper wick: The highest price reached in that time.
- Lower wick: The lowest price reached.
🟢 Example:
If Bitcoin opened at $60,000 and closed at $61,000 (with a high of $61,500 and a low of $59,800), you’d see a green candle with wicks above and below.
3. The Story Each Candle Tells
Once you know how to read the parts, you can interpret what’s happening in real time:
- Long green candle: Strong buying momentum — bulls are in control.
- Long red candle: Strong selling pressure — bears dominate.
- Small body (Doji): Indecision — buyers and sellers are balanced.
- Long wick on top: Price was pushed up, but sellers forced it down — possible reversal signal.
- Long wick on bottom: Buyers are fighting back after a sell-off — possible bounce ahead.
Think of candles as the market’s heartbeat — each pulse gives clues about strength, weakness, and exhaustion.
4. The Power of Candlestick Patterns
Individual candles are useful, but patterns of two or three candles reveal even more about trader psychology.
Here are the key beginner-friendly ones:
a) Bullish Engulfing
- A small red candle followed by a larger green candle that completely covers it.
- Signals: Buyers have taken control — a potential upward move ahead.
b) Bearish Engulfing
- A small green candle followed by a big red one that “engulfs” it.
- Signals: Sellers overpower buyers — downward momentum likely.
c) Hammer
- Small body at the top, long wick below.
- Signals: Rejection of lower prices — possible trend reversal upward.
d) Shooting Star
- Small body at the bottom, long wick above.
- Signals: Price rejected at higher levels — sellers might take over soon.
5. How to Practice Reading Charts
Here’s a 5-minute daily exercise to strengthen your price action intuition:
- Open a chart (BTC/USDT or ETH/USDT).
- Switch to the 1-hour timeframe.
- Pick one candle and ask:
- Who’s in control (buyers or sellers)?
- Where was the struggle (look at the wicks)?
- How does this candle relate to the previous one?
- Mark bullish and bearish patterns with notes.
- Zoom out to see if your interpretation fits the overall trend.
Over time, you’ll begin to recognize patterns instantly — just like learning to read words instead of letters.
6. Bonus Tip: Combine Candles with Key Levels
Price action becomes powerful when you combine it with support and resistance zones.
- Support: A level where price often bounces upward.
- Resistance: A level where price tends to reverse downward.
A bullish engulfing near support or a shooting star near resistance often gives high-probability trade setups.
7. Why Price Action Beats Indicators for Beginners
Indicators like RSI or MACD can lag behind real movement. Candlestick charts, however, show raw, unfiltered data — you see what’s actually happening, not what an indicator calculates after the fact.
Understanding price action teaches you to:
- React faster to market shifts
- Avoid false indicator signals
- Build confidence in your trading decisions
Final Thoughts
Reading candlestick charts isn’t just a technical skill — it’s like learning to read emotion. Every candle represents thousands of traders buying, selling, hesitating, or panicking.
Once you can interpret those emotions through price action, you’re no longer a blind trader — you’re a strategist reading the heartbeat of the market